|
A discussion on the Facebook Page prompted me to try something out: I've created a coupon code called PRINT-EXCHANGE so that you can "exchange" your PDF season for a printed season.
It gives 5% off any order. But the important part is that if you use it to buy a printed season, I will search the order system for a matching PDF purchase — and issue a refund for that PDF purchase. You shouldn't have to pay for the same season twice. And it's okay to change your mind (e.g. after your printer dies, or you find out that Office Max is really expensive). Printed seasons already include access to the PDF files. So you can keep and enjoy the PDF files (and I don't have to remember to send you the links, because you already have them). You can only use one coupon per order. So you can't combine this with any sales that I run. I still think it's something that some people will want to take advantage of. The bad news is that I only have 12 printed seasons in stock. (But I'm doing my best to increase this number.) This coupon expires June 16th, 2024. But I may bring it back later if people find it useful.
0 Comments
Rich Capellini recently posted the following question to the Season Ticket Baseball Facebook Group:
With respect to pitcher fatigue, the rules define “baserunner” as a hit, walk or hit batter. I’m curious as to why an error doesn’t contribute to fatigue. Clay…? My answer: Big Picture: It doesn't matter. The effect on the sim of counting errors as baserunners would be neglible. If it makes more sense to you to count an error as a baserunner, go for it! Smaller Picture (i.e. getting into the weeds): "Fatigue" isn't just about how tired the pitcher's arm is. It's about creating game mechanics that make the engine behave the way I want it to. And that makes managers (human or "auto") behave the way they realistically would in that situation. It usually takes 5+ pitches to strike someone out. And most home runs happen in the first 3 pitches of an at bat. So why does giving up a home run cause more "fatigue" than striking someone out? It's because I'm not just measuring muscle fatigue. I'm trying to reflect whether the pitcher is "losing it". If they are, then the game should apply a penalty that reflects this. And that penalty should also encourage the manager to bring in a relief pitcher — because that's what usually happens in real life. Imagine the Red Sox are leading 5-2 going into the bottom of the 8th with Pedro Martinez on the mound. Scenario #1: Pedro strikes out the first two batters. Grady Little leaves him in to try to get the third out. Scenario #2: Pedro walks the first batter and hits the second batter. Grady Little goes to the bullpen. Scenario #3: Pedro gives up a double to the first batter and a home run to the 2nd batter. Grady Little goes to the bullpen. If Fatigue was just a measure of batters faced, there would be no difference between these three scenarios. But in real life, there is a difference. Season Ticket reflects this difference by making his Fatigue higher in Scenarios #2 and #3 than in Scenario #1. Now, imagine Scenario #4: Pedro starts the 8th inning facing Derek Jeter. His first pitch is a fastball that paints the outside corner. His next is a knee-buckling curve ball that falls in for strike two. His 0-2 pitch is a perfect changeup that drops out of the zone but Jeter gets his bat on it and grounds it short. Nomar Garciaparra fields it and throws it over Kevin Millar's head for an E6. Bernie Williams comes to the plate with Jeter on first. He works the count to 2-2 then Pedro spots an inside fastball just above the strike zone (what Eckersley would call "high cheese"). It jams Bernie for a soft fly ball to short left field, but Manny Ramirez drops it! Jeter advances to 3rd and Williams ends up at safe at 2nd on a 2-base error by Manny. Does the manager pull Pedro? I don't actually know the answer to this question. I would like to collect data from the last 100+ years about when managers pull their starters in the middle of the inning. Specifically, what are the stats for the last batter before the manager goes to the pen. I know from watching a lot of baseball that a manager is far more likely to pull a pitcher after they allow a home run than after they strike someone out. But I don't have good data on whether they are likely to pull the pitcher after a batter reaches on error. I also don't know if it varies by manager, or by era. That, to me, is the main factor here. If you think that a manager is likely to pull their starter after a batter reaches on an error (ROE), then it probably makes sense to count the ROE as a "baserunner". This data exists (in Retrosheet). But I haven't taken the time to collect it and analyze it, and I'm not aware of anyone who has. In the meantime, I'm happy to admit three things: 1) I don't know whether an ROE should count as a baserunner. 2) The "real" answer is probably somewhere in the middle (i.e. an ROE should cause less "fatigue" than allowing a walk or hit, but more fatigue than getting the batter out). 3) The effect is tiny, so either answer is fine.
So, I started work on these sets. My first idea was to create several different sets of 16 teams each. But I soon got stuck deciding which teams to include. Do I include the 1963 Dodgers or the 1965 Dodgers? Is it worth including the 1939 Yankees if I already have the 1936 Yankees? And so on...
Then I realized that, at least for the PDF versions of these sets, I don't have to decide. Because it doesn't cost me anything to include extra teams, I can include every league champion from every year. When I eventually create printed sets of all-time teams, I will need to prune the list to keep costs down. But for PDF collections, I've decided to create sets for each decade that include all the World Series teams from that decade (plus a few extras — like the 2001 Mariners -- as needed). I've only created one set so far: the 1980s. (Twenty teams for just $9.00!)
If you buy this set, please let me know if you find any problems. I'd like to get any bugs worked out before I create the sets for the other decades. Thank you! Q: Why do batters in Season Ticket Baseball hit so many fly outs to the opposite field? Shouldn't they be pulling the ball? A: We know that most home runs are pulled by the batter. Right-handed hitters hit most of their homers to left field and lefties hit most of their homers to right. This table of home runs in the 2023 season shows hitters pulling more than 70% of their home runs: 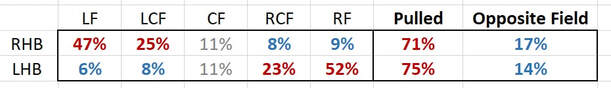 Based on this fact, you would think that most fly outs are also pulled. Home runs are just a subset of fly balls. So, we would expect that batters that pull their home runs would tend to pull all their fly balls. This is what I always assumed before I started looking at the data. Here's a breakdown of fly outs and popouts in 1986 (not including bunts): 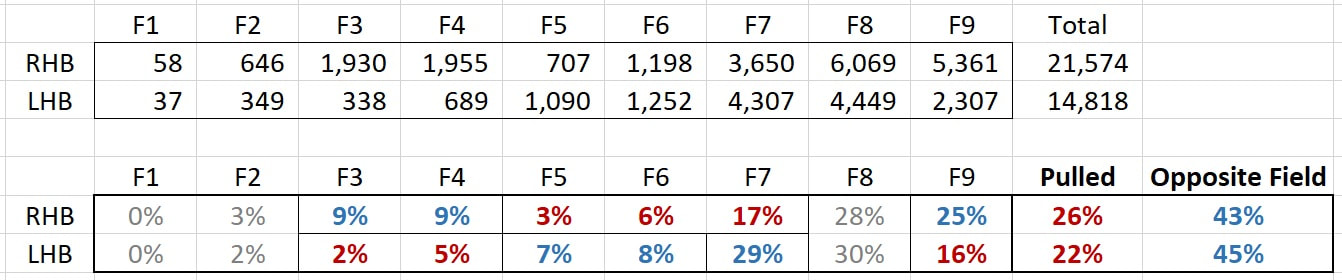 This surprised me when I first discovered it, but it makes sense when you think about it. If you have a baseball and bat, put the ball on a chair or table and slowly swing the bat at the ball as if you were going to hit it squarely back at the pitcher.
Swing again, but this time move the bat down an inch. You can see that hitting under the ball will hit it into the air. You will also see that the bat head is below your hands, causing the ball to fly away from you (to the opposite field) as it comes off the bat. You can also do the same thing for ground balls. Position your bat to hit the top of the ball and it will be driven down into the ground AND pulled. There are exceptions to these examples, like a pitch above the waist. But most fly balls are hit on strikes and that means they go to the opposite field more often than they are pulled. A great example of this is the fact that left-handed hitter Joey Votto went the first 6,828 plate appearances of his career without ever popping up to first base. When he gets under a pitch, he tends to pop up to the opposite field (i.e. third base or shortstop). It's very unlikely for him to pop up to first base.
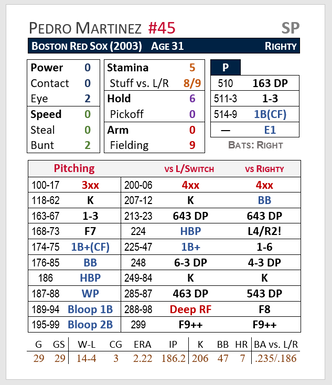
One point of Stuff also equates (roughly) to one level of Fatigue. For example, the Pedro Martinez card above shows a Stuff of 8 versus lefties. With 3 levels of Fatigue, he is roughly as effective as a pitcher with a Stuff of 5.
Calculation Stuff estimates a pitcher's overall effectiveness (versus lefties and righties, respectively) by calculating the number of runs allowed or prevented on their Pitching Table, compared to the league average, using the following linear weights:
I now have the following printed seasons available for purchase at the following prices: (These prices include a 10% discount for using the coupon code FACEBOOK) I wish these prices were lower. For comparison, you can buy the 1971 cards from Strat-O-Matic for $63. That's 23% cheaper than buying the 1971 set for Season Ticket Baseball. I happen to believe Season Ticket cards are a better value for a number of reasons:
 After shipping, I'm paying 7.6 cents per card (and this is the best price I found after getting bids from six different companies). This brings the cost for the 1971 season set to about $51.
I'm still getting bids from other printers, and working to reduce costs by increasing the size of each orders. But I just wanted you to know that I'm not price gouging. These are the costs, and there would be very little profit margin if I had to compete with Strat-O-Matic on price.
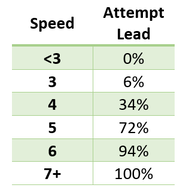
For 1923, when the stolen base success rate was only 55%, about half the players have a Steal rating of 3 or more. But teams have become much more selective about stealing in the 21st century, meaning that a player's Speed rating is often enough to generate all of their steal attempts. This is especially true in 2023, when the MLB rule changes have further increased the average success rate.
October Update:
1. I have finished completing all of the updates described here for all PDF seasons from 1950-2022. 2. PDF seasons before 1950 didn't require any updates. As of today (May 19, 2023), new cards have been uploaded to the server for the 1960-1969 seasons. If you buy any seasons from the 1960s today, you will receive the most current files. If you already purchased any of these seasons, you should already have a link to these files. (And if you can't find it, send me an email.)
I plan to update all seasons from 1950-2022 before I publish any seasons before 1950. I mentioned last year that I was working on the following improvements to the player cards:
In addition to the above, I'm also making the following improvements: 1. Realistic distribution of outs among fielders. The number of putouts, assists and double plays by each position now matches real-life totals much more closely. This doesn't affect "high-level" stats like Batting Average and ERA; but it will improve the accuracy of defensive stats like Fielding Percentage and Range Factor. 2. Changes to some defensive ratings (Arm, Range and Fielding). As part of the above, I tweaked some ratings to improve the statistics produced. You might notice that Arm ratings were nudged up a bit for right fielders, and reduced a similar amount for left fielders. I don't think any rating was changed by more than 1 point. 3. Tweaks to strikeout and walk rates. The current cards are producing about 5% too many strikeouts and about 5% too few walks (primarly because I miscalculated the chance of a strikeout or walk occurring when a die roll is redirected from the pitcher card to the batter cards). 4. Tweaks to pitcher Stamina ratings to create more realistic complete game totals. 5. Removed intentional walks from pitching stats before calculating card results. (I was already doing this for all batter cards). Most pitchers are affected very little by this change. But it will improve the cards for relievers that were asked to throw a large number of IBBs: 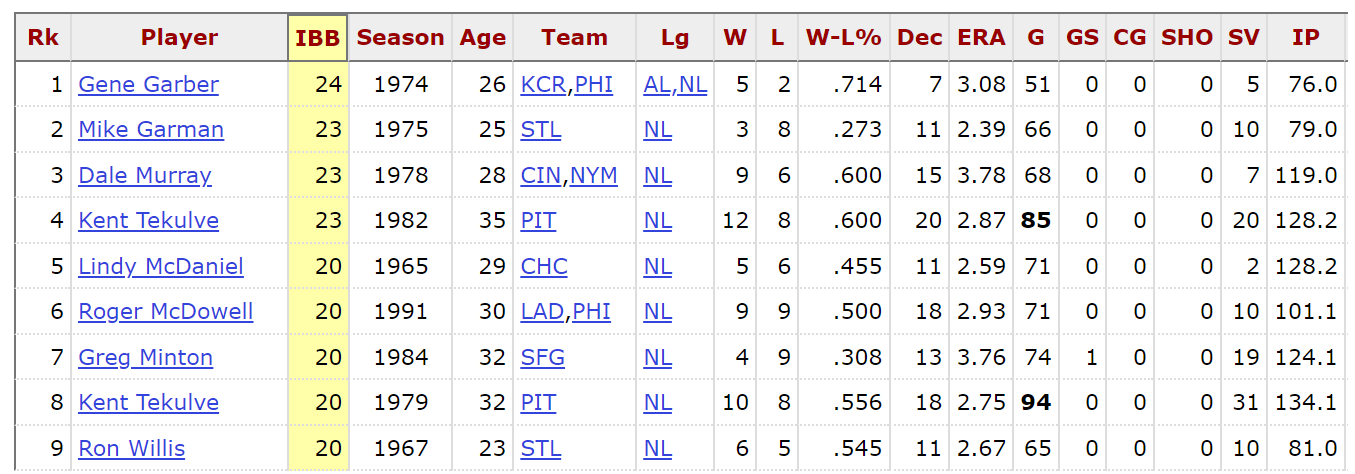 I plan to update all seasons from 1950-2022 over the next few months. After that, I will begin work on seasons before 1950.
|
||||||||||||||


 RSS Feed